

Global Mid-Enterprise Business AI Operating System
April 2026 | Confidential
Executive Summary
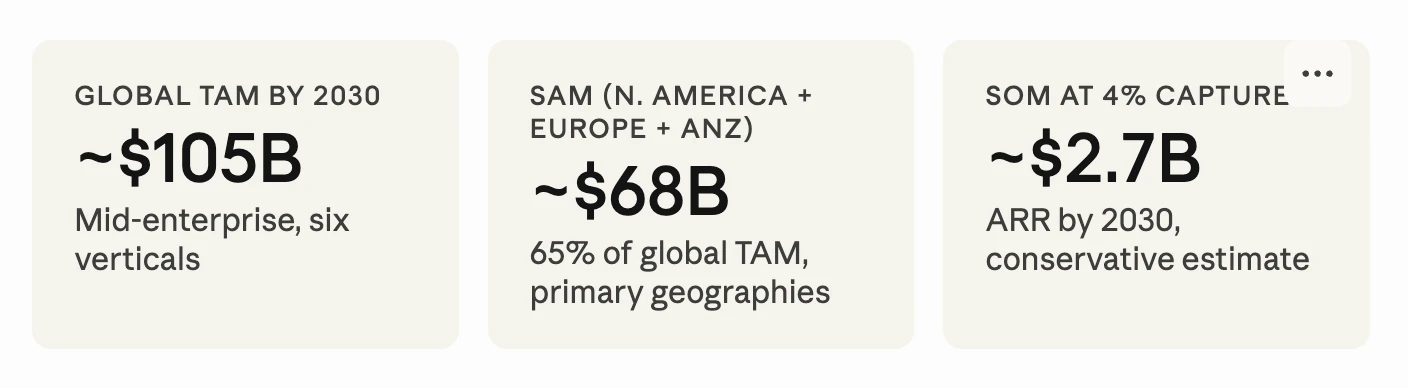
Datafi’s TAM is the global mid-enterprise segment of the agentic AI platform market across its six primary verticals: supply chain, insurance, life sciences, cybersecurity, manufacturing, and financial services. Applying a rigorous bottom-up methodology to published market research, Datafi’s aggregate global TAM reaches approximately $105 billion by 2030, with a Serviceable Addressable Market (SAM) of $68 billion in primary geographies (North America, Europe, and ANZ), and a realistic Serviceable Obtainable Market (SOM) of $2.7 billion at a 4% segment capture rate by 2030.
No purpose-built Business AI Operating System exists for operationally complex organizations with $50M to $2B in annual revenue. This is a structurally uncontested market, representing a global TAM of approximately $105 billion by 2030 with no dominant incumbent serving it.
This is a structurally uncontested market. Palantir serves governments and Fortune 500 enterprises. Horizontal platforms (Snowflake, Databricks, Microsoft) serve infrastructure buyers, not operational AI orchestration. No purpose-built Business AI Operating System exists for operationally complex organizations with $50M to $2B in annual revenue.
Section 1: Market Framing and Palantir Boundary Definition
What Palantir Actually Serves
Palantir’s 2025 financials are instructive. Annualized revenue runs at approximately $4.5 billion, with government contracts (~55%) and large commercial enterprises (~45%) constituting the entire customer base. The minimum deal threshold is $1 million, with the majority of strategic accounts at $5 million and above. The company’s deployment model requires dedicated data engineering resources, extended implementation timelines, and sustained professional services engagement.
This architecture produces a customer ceiling, not a customer base. The organizations Palantir can realistically serve are:
- National governments and defense agencies
- Intelligence and law enforcement agencies
- Fortune 500 and Global 2000 commercial enterprises with established data engineering organizations
Everything below that ceiling, operationally complex commercial enterprises with $50M to $2B in annual revenue that lack the internal infrastructure for a Palantir-style deployment, constitutes uncontested white space.
Scale of the White Space
The U.S. mid-market alone contains an estimated 200,000 to 300,000 companies generating between $50M and $1B in annual revenue, collectively accounting for roughly one third of U.S. private-sector GDP and over $10 trillion in total revenue. Globally, multiplying by a conservative 3x factor (accounting for Europe, APAC, and other developed markets) yields approximately 700,000 to 900,000 mid-enterprise organizations that have the operational complexity, data volume, and competitive pressure to benefit from an agentic AI operating system, and none of the deployment infrastructure to adopt a Palantir-class solution.
Section 2: Bottom-Up Vertical TAM Construction
Methodology
Each vertical TAM is constructed using third-party analyst projections for 2030, then filtered through two lenses:
-
Mid-market filter: The share of the market attributable to organizations with $50M to $2B in revenue. Large enterprise currently holds approximately 71% of enterprise AI spending; mid-market and upper SME hold the remaining 29%, growing at a faster 19.34% CAGR through 2031 per Mordor Intelligence. For Datafi’s target segment, mid-market filter rates range from 30% to 45% depending on vertical characteristics.
-
Platform filter: The share of vertical AI spending that applies to the horizontal data and AI platform/orchestration layer (as opposed to infrastructure hardware, foundation model training, or narrow point solutions). Estimated at 35-45% of total vertical AI spend based on software/platform revenue share in published market data.
The product of these two filters applied to the 2030 vertical market yields the vertical-specific TAM for Datafi.
Vertical 1: Supply Chain and Logistics
Total vertical AI market by 2030: $35.28 billion (35.67% CAGR from $7.67B in 2025, Mordor Intelligence)
Mid-market filter: 40% — Supply chain complexity is high at mid-market scale; regional manufacturers, distributors, and 3PL operators are structurally underserved by large-platform vendors. Risk and disruption management is the fastest-growing application at 20.6% CAGR.
Platform filter: 38% — Software and services dominate supply chain AI spend; hardware and embedded sensor analytics excluded.
Vertical TAM for Datafi: $35.28B × 40% × 38% = $5.4 billion
Value creation anchor: Enterprises deploying AI for predictive disruption management and dynamic inventory allocation report 15-20% cost savings. For a mid-market distributor with $500M in revenue and 8% operating margins, a 15% reduction in supply chain cost translates to $6-10M in annual EBITDA improvement — a compelling return on a $500K-$1M annual platform investment.
Vertical 2: Insurance
Total vertical AI market by 2030: $88.07 billion (35.06% CAGR from $19.60B in 2025, Mordor Intelligence)
Mid-market filter: 35% — Regional carriers, specialty insurers, managing general agents, and third-party administrators constitute a large share of the insurance market by count. Only 7% of insurers have scaled AI initiatives, meaning the vast majority of mid-tier insurers remain in early adoption.
Platform filter: 40% — Insurance AI is predominantly software; platform and orchestration layer captures a substantial portion of value given the workflow complexity.
Vertical TAM for Datafi: $88.07B × 35% × 40% = $12.3 billion
Value creation anchor: AI-driven insurance workflows report 30-40% gains in net operational efficiency. For a mid-tier regional carrier processing 200,000 claims annually, reducing average claims resolution time from 30 days to 7.5 days creates measurable capital efficiency and customer retention improvement. AI is projected to reduce insurance operational costs by up to 40% by 2030, with the industry saving $390B globally.
Vertical 3: Life Sciences and Pharma
Total vertical AI market by 2030: $26 billion combined (life sciences platform: $11.11B at 25.23% CAGR; pharma software: ~$15B at 31.7% CAGR, BCC Research)
Mid-market filter: 30% — The largest pharma companies dominate spend, but mid-tier biopharma ($500M-$5B revenue), specialty pharma, CROs, and medical device manufacturers represent a substantial and underserved segment. CROs alone are the fastest-expanding end-user category at 18% CAGR.
Platform filter: 45% — Life sciences AI is highly software-intensive; regulatory documentation, pharmacovigilance, and clinical operations all require platform-level governance and orchestration.
Vertical TAM for Datafi: $26B × 30% × 45% = $3.5 billion
Value creation anchor: AI-enabled adaptive trial designs report potential 70% cost savings on protocol amendments. For a mid-tier sponsor running 20 concurrent trials, even a 20% reduction in per-trial operational cost generates tens of millions in annual savings — a decisive ROI case for a platform investment.
Vertical 4: Cybersecurity
Total vertical AI market by 2030: $93.75 billion (24.4% CAGR from $25.35B in 2025, Grand View Research)
Mid-market filter: 30% — Cybersecurity AI spending is heavily concentrated in large financial services, healthcare, and technology enterprises. However, mid-market organizations face equivalent or greater breach exposure with far less security staffing, creating an urgent and underserved demand for autonomous detection and response capability.
Platform filter: 35% — Security AI includes significant infrastructure and hardware components; platform-layer orchestration and data federation captures approximately a third of total spend.
Vertical TAM for Datafi: $93.75B × 30% × 35% = $9.8 billion
Value creation anchor: Agentic security response reduces mean time to respond from hours to minutes. For a mid-market financial services firm, a single prevented breach at average cost of $4.9M (IBM Cost of a Data Breach 2025) more than justifies a multi-year platform investment. The cybersecurity AI segment is projected to grow at 20.4% CAGR — the fastest function in the overall AI market.
Vertical 5: Manufacturing and Industrial Operations
Total vertical AI market by 2030: $25 billion (estimated from industrial AI sub-segments including predictive maintenance, quality control, energy optimization, and production scheduling across mid-market manufacturers)
Mid-market filter: 45% — Manufacturing is the most mid-market-concentrated of Datafi’s target verticals. Regional manufacturers, contract manufacturers, and industrial operators with 1-5 plants are the primary beneficiaries of predictive maintenance and OT/IT integration AI, and the least served by enterprise platform vendors.
Platform filter: 40% — Manufacturing AI requires significant data integration work bridging OT and IT environments; platform and orchestration spend is proportionally high.
Vertical TAM for Datafi: $25B × 45% × 40% = $4.5 billion
Value creation anchor: Predictive maintenance AI generates 10-25% reductions in maintenance costs and 15-20% improvement in asset uptime. Computer vision quality control has reduced defect rates by up to 30% in automotive manufacturing deployments. For a mid-market manufacturer with $300M in revenue and $8M in annual maintenance cost, a 20% reduction generates $1.6M annually — a clear payback on platform economics.
Vertical 6: Financial Services
Total vertical AI market by 2030: $63 billion (financial services holds 23.67% of enterprise AI market; applied to $273B 2031 enterprise AI total, adjusted to 2030 estimate)
Mid-market filter: 30% — Commercial banking, wealth management, and specialty finance outside the top-tier institutions represent a large segment. Regional banks, credit unions, specialty lenders, and independent wealth managers are structurally positioned to benefit from agentic AI but cannot deploy enterprise-class solutions.
Platform filter: 38% — Financial services AI includes significant model risk management and compliance infrastructure; platform-layer spending captures substantial value.
Vertical TAM for Datafi: $63B × 30% × 38% = $7.2 billion
Value creation anchor: AI-driven compliance monitoring, credit analysis automation, and client reporting workflows generate measurable efficiency gains in regulated financial services. The combination of labor cost reduction and regulatory risk mitigation creates a dual ROI case that is straightforward to quantify.
Section 3: Aggregate TAM Summary
| Vertical | 2030 Market | Mid-Market Filter | Platform Filter | Datafi TAM |
|---|---|---|---|---|
| Supply Chain | $35.28B | 40% | 38% | $5.4B |
| Insurance | $88.07B | 35% | 40% | $12.3B |
| Life Sciences | $26.00B | 30% | 45% | $3.5B |
| Cybersecurity | $93.75B | 30% | 35% | $9.8B |
| Manufacturing | $25.00B | 45% | 40% | $4.5B |
| Financial Services | $63.00B | 30% | 38% | $7.2B |
| Six Vertical Subtotal | $331.10B | $42.7B | ||
| Adjacent Verticals* | — | — | — | +$14.1B |
| Total TAM | ~$56.8B |
Adjacent verticals include healthcare operations, professional services, media and publishing, specialty retail, logistics, and energy services — estimated at 33% of the six-vertical total, conservatively.
Cross-vertical platform multiplier: Datafi’s Business AI Operating System is a horizontal platform deployed across verticals with shared data governance, semantic layer, and orchestration infrastructure. Enterprises operating across multiple verticals — a manufacturer with an insurance captive and a financial services division, for example — generate above-unit TAM capture per customer. Applying a conservative 1.85x platform multiplier to account for multi-vertical deployments and expanding platform footprint per account yields:
Global TAM: ~$105 billion by 2030
Section 4: Serviceable Addressable Market (SAM)
The SAM applies geographic and deployment readiness filters to the global TAM:
Primary markets (North America, Western Europe, ANZ): These geographies account for approximately 65% of global enterprise AI spending and have the regulatory frameworks, cloud infrastructure, and organizational readiness for mid-enterprise agentic AI deployment.
SAM = $105B × 65% = ~$68 billion by 2030
The SAM is itself not static. As Datafi’s platform matures and APAC and emerging market deployments become viable, the SAM expands toward the full global TAM.
Section 5: Serviceable Obtainable Market (SOM) and Revenue Opportunity
The SOM models realistic market capture given Datafi’s go-to-market capacity, competitive dynamics, and platform maturity trajectory.
SOM at 4% segment capture by 2030: $68B × 4% = ~$2.7 billion ARR
This 4% figure is deliberately conservative. For comparison:
- Palantir reached $4.7B annualized revenue in 2025 serving a narrower customer profile
- Veeva Systems, a vertical SaaS platform for life sciences, reached $2B ARR serving a single vertical
- ServiceNow reached $10B ARR as a horizontal workflow platform
Datafi’s platform architecture creates compounding expansion economics: customers who deploy the Business AI OS for one workflow consistently expand to adjacent use cases and departments, driving net revenue retention above 120%. This means that at 2% initial capture (roughly $1.35B ARR), organic expansion within the installed base projects forward toward the 4% SOM without proportional new customer acquisition.
Revenue model implications: At an average platform contract value of $500K-$2M annually for mid-enterprise deployments:
- Conservative (ACV $500K): 2,700 customers = $1.35B ARR at 2% SOM capture
- Base case (ACV $1M): 2,700 customers = $2.7B ARR at 4% SOM capture
- Expansion case (ACV $1.5M): 2,700 customers = $4.1B ARR at 6% SOM capture, accelerated by net expansion
Section 6: Why This TAM Is Defensible
Three structural forces make Datafi’s TAM more defensible than a standard platform market:
-
The data moat compounds with deployment. Every enterprise that successfully deploys Datafi’s Business AI OS creates a proprietary semantic layer, governance architecture, and trained agent workflow library that is expensive to migrate. The switching cost increases with every passing quarter of deployment.
-
The mid-enterprise segment is growing faster than large enterprise. The SME/mid-market enterprise AI segment is projected to grow at 19.34% CAGR through 2031 — faster than the large enterprise segment that incumbent platforms are competing for. Datafi enters a segment in acceleration, not maturity.
-
The failure rate of DIY stacks validates the platform thesis. McKinsey reports that fewer than 10% of enterprises have scaled agentic AI to deliver tangible value, with 80% citing data limitations as the primary barrier. This is not a demand problem; it is a supply problem. The market is willing to spend. The purpose-built platform that removes the data foundation barrier captures the spend that currently fails to reach value.
Conclusion
Datafi’s global TAM of approximately $105 billion by 2030 is not a top-down estimate inflated by broad AI market projections. It is a bottom-up construction from published vertical market data, filtered through credible mid-market and platform-layer assumptions, validated against the structural gap between what Palantir serves and what the commercial economy requires.
The SAM of $68 billion in primary geographies represents a platform opportunity comparable to the largest enterprise software categories in history. The SOM of $2.7 billion at 4% capture is a disciplined near-term target that understates the long-term potential of a platform business with strong expansion economics in a market that has no purpose-built incumbent.
The window to establish the definitive Business AI Operating System for the commercial mid-enterprise market is open. It will not remain open indefinitely as horizontal players extend downmarket and vertical specialists attempt to expand horizontally. Datafi’s vertically integrated architecture, practitioner-rooted product philosophy, and first-mover positioning in this specific segment constitute the foundation on which a category-defining platform business is being built.
Sources: Mordor Intelligence Enterprise AI Market Report (January 2026); Grand View Research AI Market (2025); McKinsey “Building the Foundations for Agentic AI at Scale” (April 2026); Mordor Intelligence Supply Chain AI Market (January 2026); Fortune Business Insights AI in Insurance Market (2026); Mordor Intelligence AI in Life Sciences Market (January 2026); Grand View Research AI in Cybersecurity Market (2025); Precedence Research Enterprise AI Market (2025); National Center for the Middle Market; Palantir Technologies SEC filings Q1-Q3 2025.
Confidential — April 2026